What's Your Neighborhood Doing To Fight Climate Change?
Transit and Housing Density are a Big Freaking Deal.
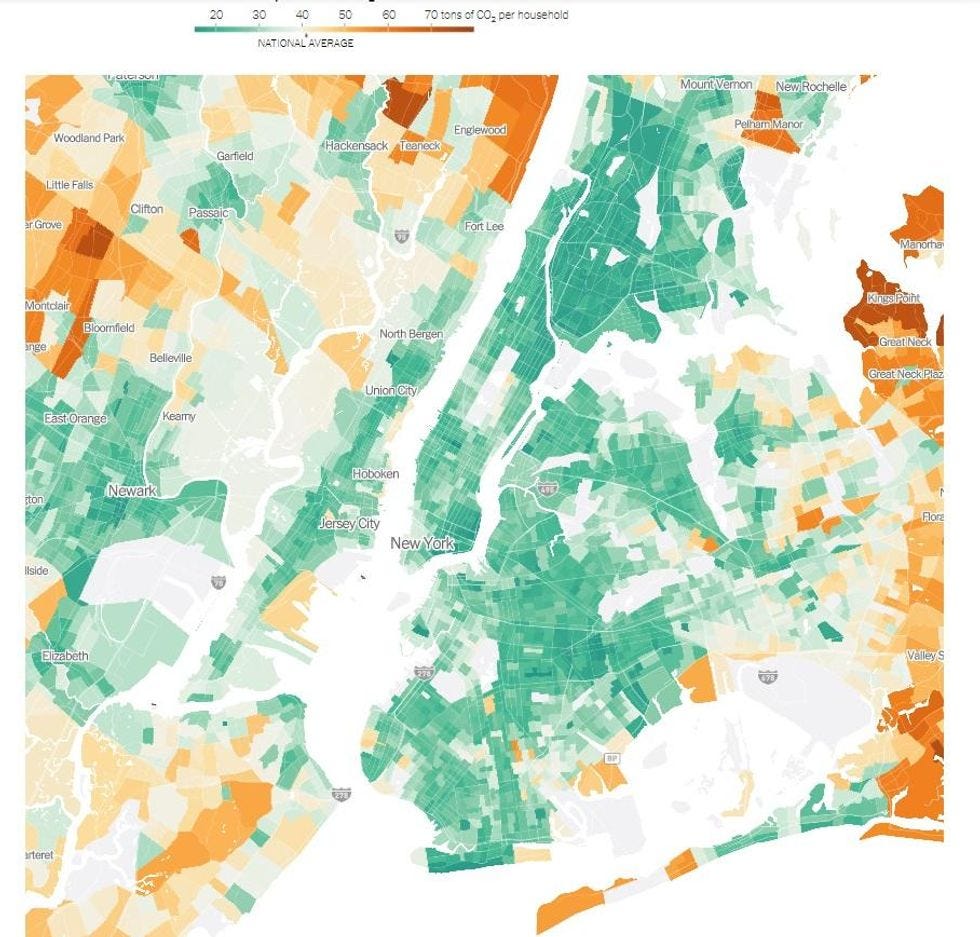
The New York Times brings us a pretty cool data visualization mapping out the carbon emissions in cities around the US, comparing neighborhoods by the amount of greenhouse gases for which their residents are responsible, at least statistically. Rather than showing where carbon emissions actually enter the atmosphere — that would be a map of powerplants, factories, major roads, and airports — the maps look at the emissions generated by what households typically consume in a given area. As the Times 'splainers (free gift linky),
Households in denser neighborhoods close to city centers tend to be responsible for fewer planet-warming greenhouse gases, on average, than households in the rest of the country. Residents in these areas typically drive less because jobs and stores are nearby and they can more easily walk, bike or take public transit. And they’re more likely to live in smaller homes or apartments that require less energy to heat and cool.
Moving further from city centers, average emissions per household typically increase as homes get bigger and residents tend to drive longer distances.
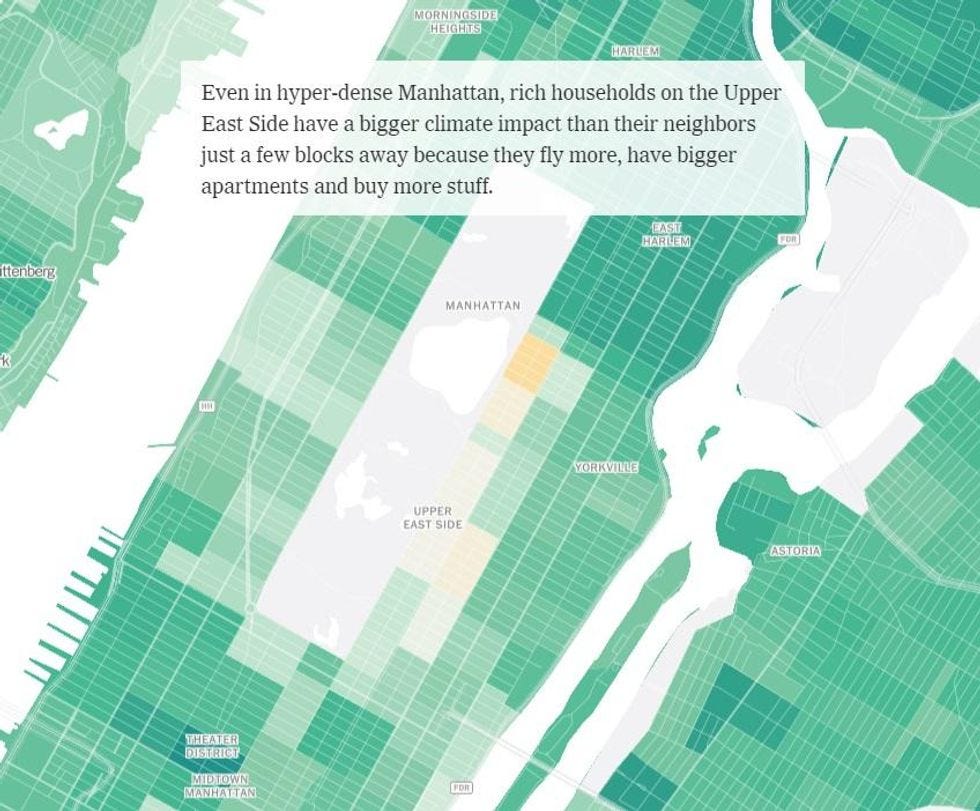
Wealth also factors into energy use: You have more money, you tend to buy more stuff and travel more.
For one of the most dramatic maps, take a look at New York City, where the densest urban areas have far lower emissions than the 'burbs, largely because more people live closer together and drive less.

New York Times map
Because it's a fun interactive map, the page zooms out to let you see all the high-emissions areas surrounding the city, and also zooms way in to point out that wealthier areas have higher emissions because they consume more:

New York Times map
The maps use data from all over the USA, compiled by UC Berkeley and the affiliated EcoDataLab consulting firm; the goal isn't just to help people see what their own cities' consumption and climate impact looks like, but also to give state and local governments data to help them find ways to reduce emissions locally,
by, for example, encouraging developers to build more housing in neighborhoods where people don’t need cars to get around or helping households in suburbs more quickly adopt cleaner electric vehicles.
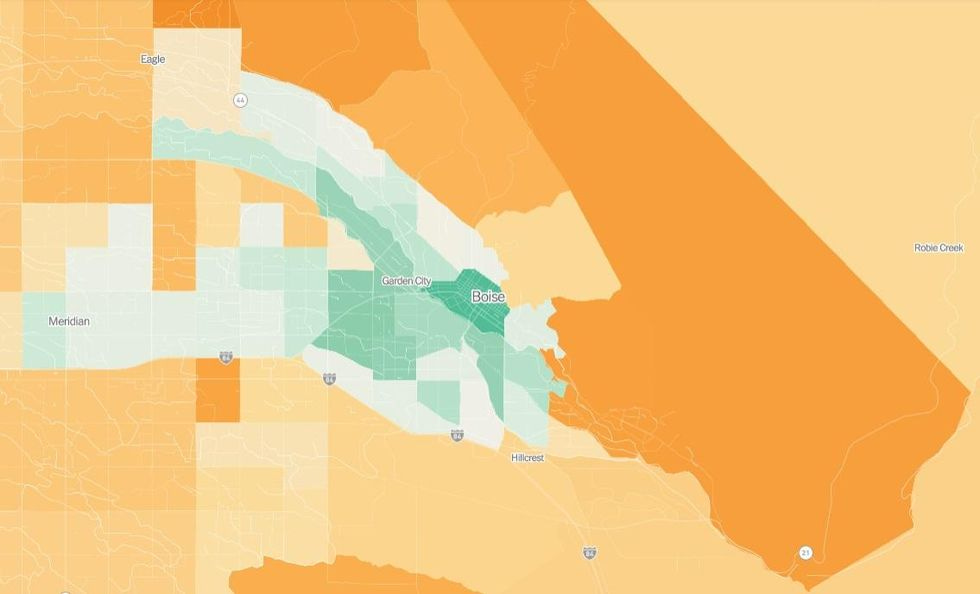
Because the Times knows where I live (yeah, yeah, it's just my IP address, that's not unsettling), it loaded up a map for Boise, and the lower-than-national average parts of this burg map pretty well to the city's two major bus routes and densest neighborhoods:

The burbs here have all those folks with larger homes and pickups, so that makes sense too. The numbers are averaged by Census tract, so the map may not reflect whether any particular neighbor has a giant Trump flag flying from said pickup. As the Times explains,
The researchers used a model, a simplified mathematical representation of the real world, to estimate the average household’s emissions in each neighborhood based on electricity use, car ownership, income levels, consumption patterns and more. Driving and housing are frequently the largest contributors to a household’s carbon footprint, although what people eat, what they buy and how often they fly are also important factors.
The article also notes that while we certainly should do all we can to reduce our personal carbon footprints, the maps also make clear that
household emissions often depend on factors that individuals have limited control over, such as whether public transportation is available in their neighborhoods or whether electricity in their area comes from a highly polluting coal-burning plant or emissions-free solar, wind or nuclear plants.
“Consumption is not the individual act we all think it is,” said Siobhan Foley, head of sustainable consumption at C40, a network of the world’s biggest cities committed to addressing climate change. “We treat it like a personal choice, but it’s shaped by all these other factors.”
I'm in one of those lightish-green areas of Boise, but that almost certainly has more to do with being within fair distance of the bus, even if I do drive a hybrid. Similarly, much of the US is built to burn gasoline and have large homes, what with all the suburbs and exurbs zoned for single-family homes. And this is also where we can be climate activists: show up for the public meetings on utilities and zoning and transit, and let the boards know you want more renewable energy, more electric buses, more infill so we're making better use of energy.
As one of the Berkeley scientists, Chris Jones, director of the university's CoolClimate Network , tells the Times, every community can take steps to get people closer to the stores and services they need, so residents drive less, or change how they're using resources: "It’s not about moving everyone to New York City."
That's probably a huge relief to New York too!
[ New York Times (gift link) / The Big Fix: 7 Practical Steps to Save Our Planet (Wonkette gets a cut of sales) / Image created using DreamStudio Lite AI ]
Yr Wonkette is funded entirely by reader donations. If you can, please give $5 or $10 a month to help us keep you up to date on this climate stuff, which we understand all the cool kids are talking about these days.
Do your Amazon shopping through this link, because reasons .


I recall reading about a cool streetcar system in, I want to say Minneapolis, that was eventually torn up in favor of cars. It's sad to think about now.
I'm trying to get my Trump-supporting neighbors to cut down on their greenhouse, gas emissions.
They wake me up, at night.